


ST. LOUIS — The city of St. Louis continues to lose Black residents, new census estimates show, while the white population has remained largely unchanged in recent years.
Black residents totaled 136,167 as of July 1, 2019, or 45.3% of the city’s population, according to estimates to be released Thursday by the U.S. Census Bureau.
That represents declines of 2,928 from the 2018 estimate and of 20,993 from the 2010 census.
Meanwhile, the city’s white population numbered 144,649, or 48.1%, in 2019. That’s an increase of 348 from the 2018 estimate and 4,382 since 2010.
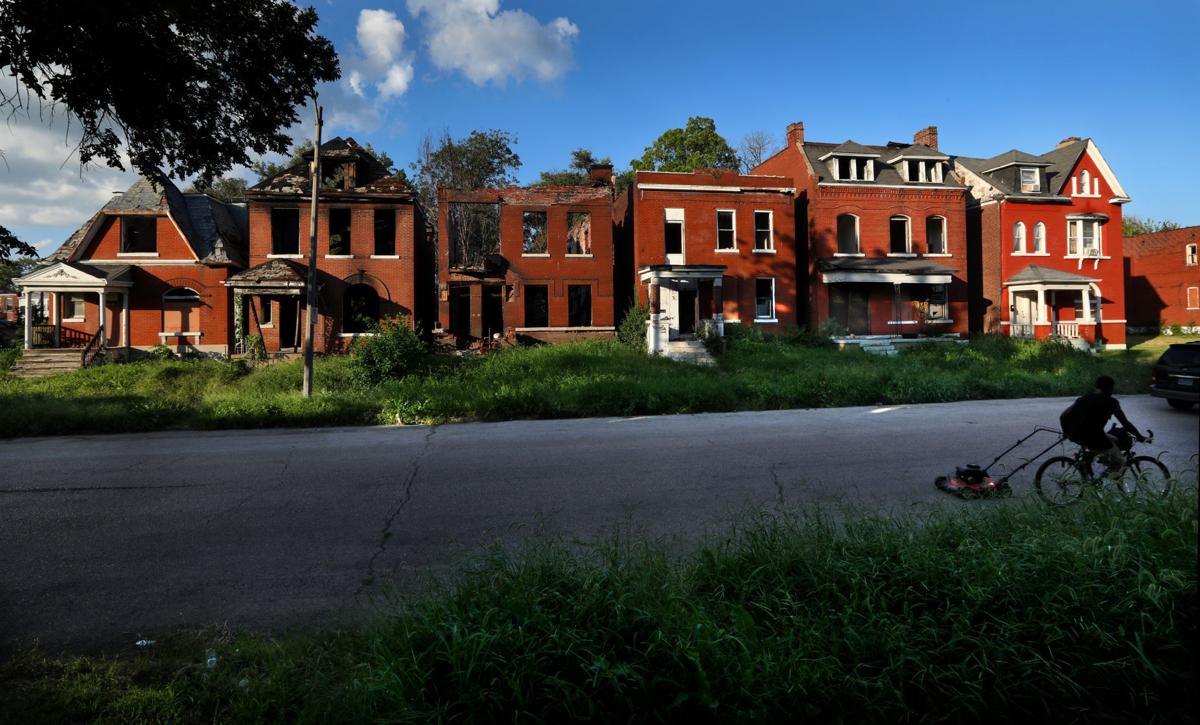
The chairman of the city Board of Aldermen’s African American caucus, Jeffrey Boyd, blamed the drop in Black population on “disinvestment” and deteriorating housing in many North Side neighborhoods.
“If people are living in uninhabitable conditions, they move,” said Boyd, D-22nd Ward.
People are also reading…
He added that the disinvestment is due in part on “slumlords” who don’t maintain their property.
Andre Alexander, who is involved in efforts to bring new life to the Jeff-Vander-Lou neighborhood, said the new estimates on accelerated Black flight “don’t surprise me, they sadden me.”
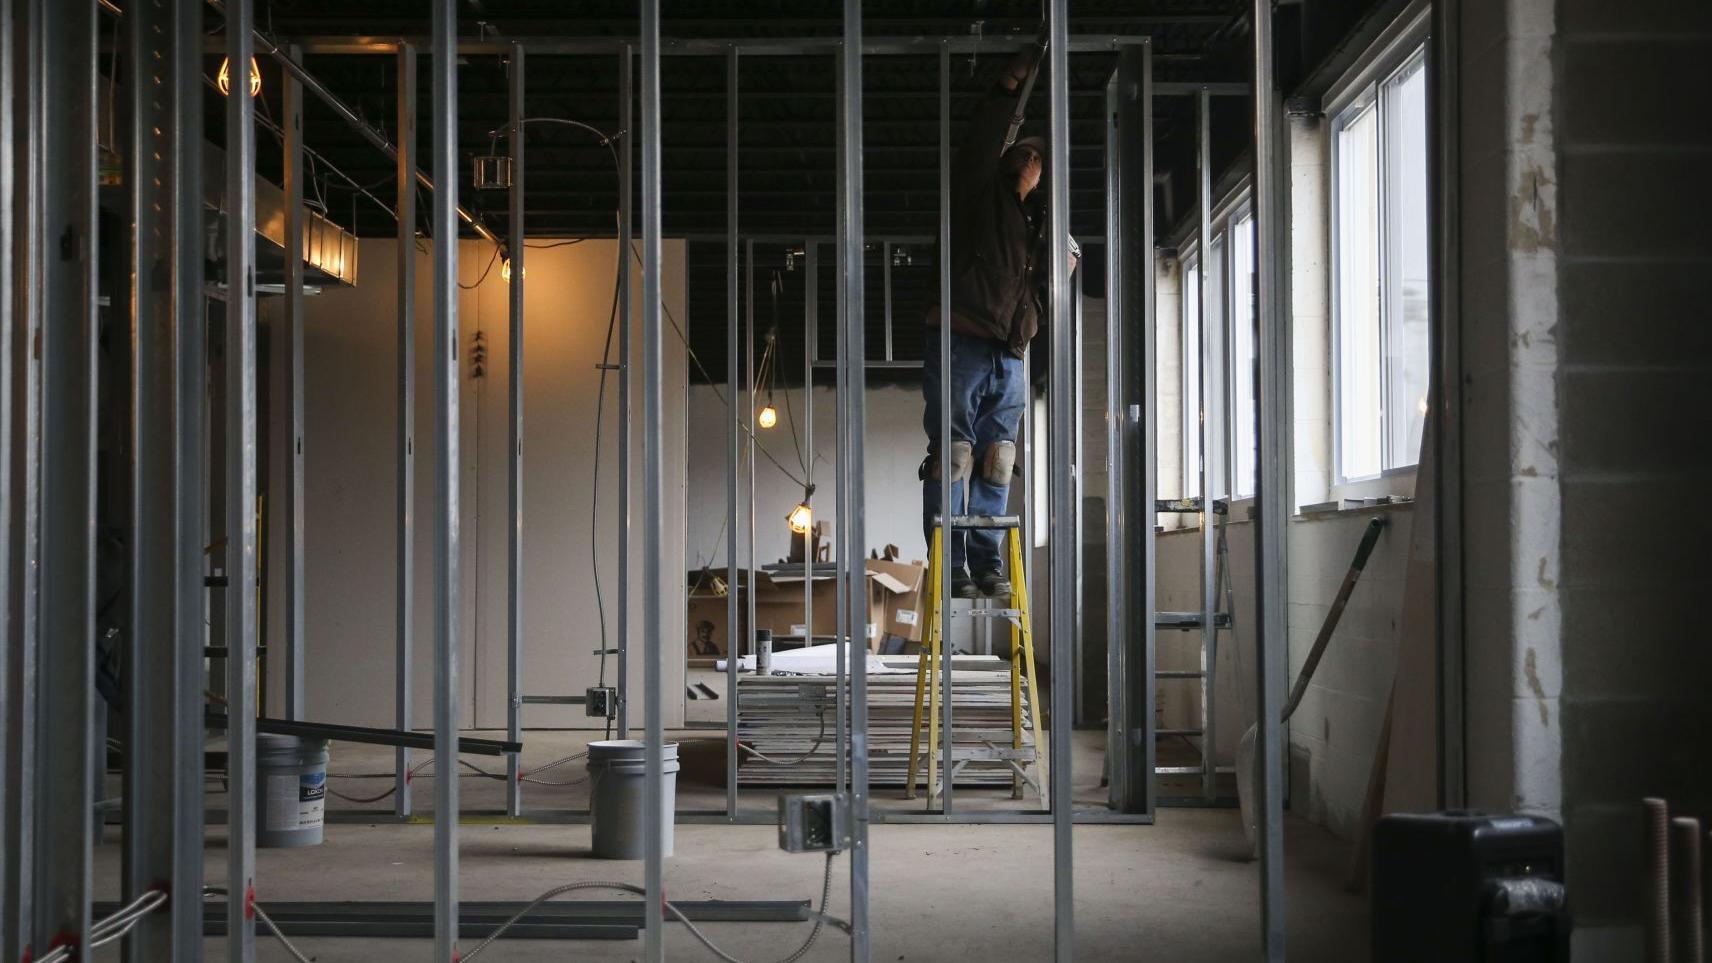
He said “unless some significant investment” in housing stock on the North Side is made, more and more African Americans will continue to leave the city for St. Louis County and Metro East communities.
Alexander, a minister, heads the Tabernacle Community Development Corp., which has been rehabbing existing homes and buying and demolishing buildings beyond repair.
The city’s overall population has been steadily sliding in the past decade, down from 319,294 in 2010 to just above 300,576 last year.
But the census estimates underscore a trend that suggests that Black residents have led the more recent part of the exodus from the city, where they once were a majority.
In 2000, when the city’s population stood at 348,189, Black residents made up 51.2% of the population.
The overall number of Black residents in the St. Louis metropolitan statistical area — which includes the city and 14 surrounding counties — has declined slightly, from 518,846 in 2010 to 517,518 last year.
Aldermanic President Lewis Reed said in a statement that the latest estimates “are a bit surprising to me” but that it underscores the need for “some type of major investment to grow and keep our City a desirable place for all to live, work and play.”
An aldermanic hearing was held Wednesday on Reed’s bill to put leasing St. Louis Lambert International Airport to private operators before voters. He says generating hundreds of millions of dollars to revitalize deteriorating areas is one of his goals.
Mayor Lyda Krewson’s spokesman, Jacob Long, said in an email that “this is a continuation of an ongoing trend.”
He added that these are only estimates and urged residents across the city to complete their questionnaires for the by Oct. 31, the extended deadline. “We need a more complete count,” he said. “Currently the City only has a response rate of 49.3%.”
Comptroller Darlene Green in a statement said “people vote with their feet” and that the “concerns of our Black community have gone unmet for so long.” That, she said, continues to make it difficult for some to choose to live in the city. Green also urged all residents to participate in this year’s census.
Glenn Burleigh, an official with the , said the reasons for African Americans moving out of the city are complex.
One factor, he said, is that much of the housing built in the city in recent years isn’t affordable for many Black St. Louis residents shopping for a new home. So they instead check out what’s available in the suburbs.
“When you look at the new housing coming on line in St. Louis, it is almost exclusively fairly expensive,” he said, at a sales price of $300,000 or higher.
He also said gentrification has resulted in increased prices for sales of existing homes and for rents in the central corridor and some near south side areas.
, an assistant professor of sociology at St. Louis University, also listed gentrification in some areas a possible reason for the drop in African American residents. He said crime and a search for better schools were other possible “push factors.”
He also noted that Black flight from St. Louis has been going on for decades.
, a political science professor at SLU, said the biggest takeaway from the 2019 estimates is that the city’s population as a whole has continued its steep decline since 1950.
“This just shows that St. Louis isn’t doing what it needs to do to hold its people,” Warren said.
Among other groups, the city’s Asian population has grown from 9,454 in 2010 to an estimated 10,882 in 2019, while the number of Hispanics has risen from 11,130 to 12,543.
The number of Black residents in two of the city’s neighbors — St. Louis and St. Charles counties — has increased significantly.
St. Louis County gained 14,358 Black residents from 2010 to 2019, while St. Charles County gained 6,073.
Both counties remain overwhelmingly white; in fast-growing St. Charles County, which has gained more than 40,000 people in the past decade, Black residents represent 5.3% of the overall population.
The St. Louis metropolitan area’s overall population has grown little since 2010, according to the estimates — up half a percentage point to 2.8 million last year.
Editor’s note: The 2010 numbers for Black and white city residents has been corrected; the calculations and tabled have been updated.
St. Louis population estimates
Census estimates show city’s population loss has been led by drop in Black residents. Asians, Hispanics and others, who comprise less than 7% of the city’s population, are not included in this chart. (Source: U.S. Census Bureau)
| Y������ | WHITE | % | BLACK | % | TOTAL |
|---|---|---|---|---|---|
| 2010 | 140,267 | 43.9 | 157,160 | 49.2 | 319,294 |
| 2017 | 145,406 | 47.1 | 143,500 | 46.6 | 308,233 |
| 2018 | 144,313 | 47.6 | 139,657 | 45.3 | 303,419 |
| 2019 | 144,649 | 48.1 | 136,167 | 45.3 | 300,576 |
St. Louis MSA 2010 and 2019
Population estimates show little overall change in St. Louis metropolitan statistical area, a region that includes 14 counties in Missouri and Illinois and the city of St. Louis (U.S. Census Bureau)
| COUNTY | TOTAL | WHITE | % | BLACK | % | ASIAN | % | HISPANIC | % |
|---|---|---|---|---|---|---|---|---|---|
| 2000 CENSUS | |||||||||
| Bond County, Ill. | 17,768 | 16,283 | 91.6% | 1,114 | 6.3% | 69 | 0.4% | 547 | 3.1% |
| Calhoun County, Ill. | 5,089 | 5,044 | 99.1% | 7 | 0.1% | 12 | 0.2% | 40 | 0.8% |
| Clinton County, Ill. | 37,762 | 35,709 | 94.6% | 1,374 | 3.6% | 168 | 0.4% | 1,058 | 2.8% |
| Jersey County, Ill. | 22,985 | 22,476 | 97.8% | 94 | 0.4% | 78 | 0.3% | 222 | 1.0% |
| Macoupin County, Ill. | 47,765 | 46,717 | 97.8% | 370 | 0.8% | 129 | 0.3% | 418 | 0.9% |
| Madison County, Ill. | 269,282 | 240,201 | 89.2% | 21,402 | 8.0% | 2,336 | 0.9% | 7,313 | 2.7% |
| Monroe County, Ill. | 32,957 | 32,422 | 98.4% | 73 | 0.2% | 148 | 0.5% | 450 | 1.4% |
| St. Clair County, Ill. | 270,056 | 177,439 | 65.7% | 82,736 | 30.6% | 3,359 | 1.2% | 8,785 | 3.3% |
| Franklin County, Mo. | 101,492 | 98,727 | 97.3% | 873 | 0.9% | 418 | 0.4% | 1,397 | 1.4% |
| Jefferson County, Mo. | 218,733 | 211,996 | 96.9% | 1,817 | 0.8% | 1,435 | 0.7% | 3,408 | 1.6% |
| Lincoln County, Mo. | 52,566 | 50,287 | 95.7% | 1,003 | 1.9% | 198 | 0.4% | 1,032 | 2.0% |
| St. Charles County, Mo. | 360,485 | 330,356 | 91.6% | 15,183 | 4.2% | 8,019 | 2.2% | 9,983 | 2.8% |
| St. Louis County, Mo. | 998,954 | 709,884 | 71.1% | 234,276 | 23.5% | 35,109 | 3.5% | 25,024 | 2.5% |
| St. Louis city, Mo. | 319,294 | 140,267 | 43.9% | 157.160 | 49.2% | 9,454 | 3.0% | 11,130 | 3.5% |
| Warren County, Mo. | 32,513 | 31,035 | 95.5% | 630 | 1.9% | 143 | 0.4% | 957 | 2.9% |
| Total | 2,787,701 | 2,152,634 | 77.2% | 518,846 | 18.6% | 61,075 | 2.2% | 71,764 | 2.6% |
| 2019 ESTIMATE | |||||||||
| Bond County, Ill. | 16,426 | 14,874 | 90.6% | 1,041 | 6.3% | 134 | 0.8% | 594 | 3.6% |
| Calhoun County, Ill. | 4,739 | 4,658 | 98.3% | 21 | 0.4% | 14 | 0.3% | 68 | 1.4% |
| Clinton County, Ill. | 37,562 | 35,295 | 94.0% | 1,376 | 3.7% | 224 | 0.6% | 1,198 | 3.2% |
| Jersey County, Ill. | 21,773 | 21,008 | 96.5% | 175 | 0.8% | 220 | 1.0% | 314 | 1.4% |
| Macoupin County, Ill. | 44,926 | 43,606 | 97.1% | 434 | 1.0% | 187 | 0.4% | 568 | 1.3% |
| Madison County, Ill. | 262,966 | 230,444 | 87.6% | 23,226 | 8.8% | 2,710 | 1.0% | 9,035 | 3.4% |
| Monroe County, Ill. | 34,637 | 33,834 | 97.7% | 153 | 0.4% | 209 | 0.6% | 570 | 1.7% |
| St. Clair County, Ill. | 259,686 | 168,280 | 64.8% | 79,344 | 30.6% | 4,056 | 1.6% | 11,215 | 4.3% |
| Franklin County, Mo. | 103,967 | 100,364 | 96.5% | 1,037 | 1.0% | 573 | 0.6% | 1,936 | 1.9% |
| Jefferson County, Mo. | 225,081 | 216,023 | 96.0% | 2,649 | 1.2% | 1,839 | 0.8% | 4,704 | 2.1% |
| Lincoln County, Mo. | 59,013 | 56,117 | 95.1% | 1,184 | 2.0% | 307 | 0.5% | 1,557 | 2.6% |
| St. Charles County, Mo. | 402,022 | 360,266 | 89.6% | 21,256 | 5.3% | 11,072 | 2.8% | 13,754 | 3.4% |
| St. Louis County, Mo. | 994,205 | 674,770 | 67.9% | 248,634 | 25.0% | 46,253 | 4.7% | 29,916 | 3.0% |
| St. Louis city, Mo. | 300,576 | 144,649 | 48.1% | 136,167 | 45.3% | 10,882 | 3.6% | 12,543 | 4.2% |
| Warren County, Mo. | 35,649 | 33,717 | 94.6% | 821 | 2.3% | 169 | 0.5% | 1,245 | 3.5% |
| Total | 2,803,228 | 2,137,905 | 76.3% | 517,518 | 18.5% | 78,849 | 2.8% | 89,217 | 3.2% |

Mark Schlinkmann
Reporter