


Top executives’ pay may seem like an escalator that only goes up, but the downward side of the staircase sees traffic, too.
Among 33 publicly traded companies based in the St. Louis area, 18 paid their chief executives more in 2016 than in 2015, while 15 paid them less.
The decline often matched the company’s performance. Aegion, a pipeline repair company based in Chesterfield, cited “challenging market conditions” in explaining why CEO Charles Gordon’s to $2.5 million.
At other companies, the pay decline is a matter of timing. David Hatfield at shaver and sunscreen maker Edgewell Personal Care got a whopping $7.9 million worth of stock and options when he became CEO in 2015. Since he didn’t get a similar award this year, his fell 74 percent.
People are also reading…
Overall, the CEOs of St. Louis had a good year. For the 28 men and women who headed their companies during all of 2015 and 2016, median pay rose 22 percent to $3.7 million.
The compensation packages range from the nearly $22 million earned by to the $465,173 paid to Timothy Boyd by ski operator Peak Resorts.
•��
John Dempsey, a partner at consulting firm Mercer, says his study of 81 large-company CEOs showed a 9 percent pay increase last year. “It’s a reflection of the fact that the economy was fairly solid, and the stock market went up,” he said.
Dempsey says executives benefited from an economic weak patch in late 2015, when companies set bonus targets for last year. “The great bulk of companies are linking their pay goals to their budgets,” he said. “When they were setting their budgets up, they were a little more pessimistic.”
Critics say the biggest pay packages amount to uncontrolled greed. The that an average large-company CEO earns 347 times as much as the average U.S. worker, a number that union leader Richard Trumka cites as evidence that “the system is rigged.”
Scholars who study executive pay take a more nuanced view. Very large pay packages can be justified, they say, by the value a successful executive team creates. Centene has paid Neidorff $85 million over the past five years, but its market value has increased by $10 billion.

SEC may not have time to revoke rule before it takes effect
A careful analysis of compensation plans, though, finds several flaws. Among them:
- The Lake Wobegon effect. As in the fictional town where all children are above average, most boards want their pay to be at least at the median for similar companies. Every time a company boosts its pay to catch up to the median, the median rises.
- A short time horizon. Many companies have adopted performance plans that hand executives stock or cash for meeting long-term goals — but the long term lasts just three years. , at four years, is the only St. Louis company with a longer performance period.
- Counterproductive targets. If a company sets a hard-and-fast target for, say, earnings per share, that executives pull out all the stops to hit it. Some of their actions, such as cutting research budgets, may harm the company, but they don’t want to risk not getting a bonus.
- That said, most experts think the system has improved. A decade ago, most long-term compensation came in the form of stock options or time-based restricted stock. Options could compensate an executive handsomely just because the stock market was rising, and time-based stock rewards the boss for merely sticking around.
According to consulting firm Pay Governance, 86 percent of large companies now have performance-based long-term pay plans, up from 50 percent in 2009.
With these plans, the executives lose money if they don’t meet goals. Aegion, for example, has been in a multiyear slump, and its 2014-2016 incentive plan paid out at just 46 percent of its original value.
Overall, those long-term plans account for two-thirds of total pay. Radhakrishnan Gopalan, associate professor of finance at Washington University’s Olin School of Business, says that’s a big step forward from the days when insider-dominated boards often handed out discretionary bonuses based on little more than a desire to keep the big boss happy.
“Over time, I definitely would say the executive labor market has become more competitive,” Gopalan says.
Top-paid St. Louis business CEOs
1. Centene, Michael Neidorff

Michael Neidorff, CEO of Centene, was paid more than $21 million. provides health plans through Medicaid, Medicare and the health insurance marketplace, and offers specialty health services. (For 2015 pay, he was also No. 1.)
2. Post Holdings, Robert V. Vitale

Robert V. Vitale, CEO of Post Holdings, was paid more than $18 million. ' brands include Alpha-Bits, Honey Bunches of Oats, Golden Crisp, Raisin Bran and Grape-Nuts.��(For 2015 pay, he was No. 8.)
3. Emerson, David Farr

David Farr, CEO of Emerson, was paid more than $15 million. is a technology and engineering company.��(For 2015 pay, he was also No. 3.)
4. Express Scripts, Timothy Wentworth

Timothy Wentworth, who became CEO of Express Scripts in 2016, was paid more than $14 million. manages prescription drug benefits for more than 80 million Americans.
5. Arch Coal, John W. Eaves

John W. Eaves, CEO of Arch Coal, was paid more than $12 million. produces coal.��(For 2015 pay, he was No. 17.)
6. Mallinckrodt, Mark C. Trudeau

Mark C. Trudeau, CEO of Mallinckrodt, was paid more than $12 million. makes medicine, including painkillers.��(For 2015 pay, he was No. 6.)
7. Express Scripts, George Paz
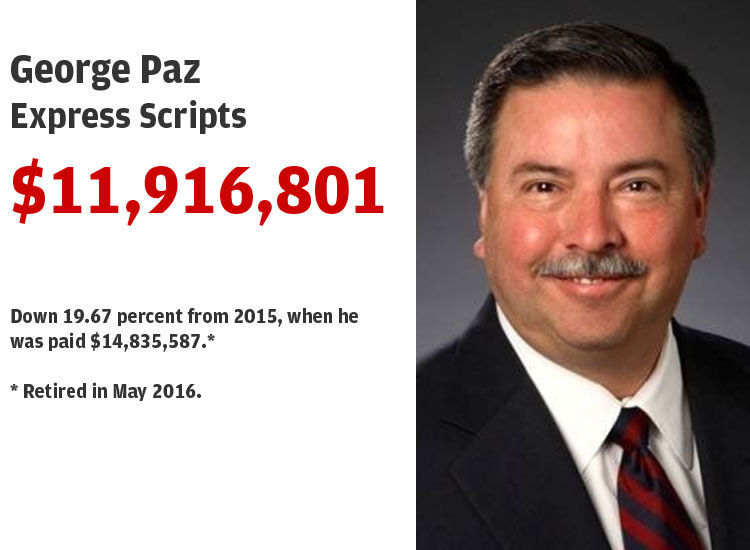
George Paz, who retired in 2016 from Express Scripts, was paid more than $11 million. manages prescription drug benefits for more than 80 million Americans.��(For 2015 pay, he was No. 4.)
8. Monsanto, Hugh Grant

Hugh Grant (not the actor, the CEO of Monsanto) was paid more than $11 million. provides agricultural products and services, including seeds and herbicides.��(For 2015 pay, he was No. 5.)
9. Reinsurance Group, A. Greig Woodring

A. Greig Woodring, CEO of Reinsurance Group, was paid more than $10 million. is a life and health reinsurance company.��(For 2015 pay, he was No. 10.)
10. Stifel, Ronald J. Kruszewski

Ronald J. Kruszewski, CEO of Stifel, made more than $9 million. is a financial advisor for institutions and individuals.��(For 2015 pay, he was No. 31.)
11. Caleres, Diane M. Sullivan

Diane M. Sullivan, CEO of , made more than $7 million.��(For 2015 pay, she was No. 12.)
12. Ameren, Warner L. Baxter

Warner L. Baxter, CEO of , was paid more than $6 million.��(For 2015 pay, he was No. 15.)
13. Energizer, Alan R. Hoskins

Alan R. Hoskins, CEO of ,��was paid more than $6 million.��(For 2015 pay, he was No. 9.)
14. Belden, John Stroup

John Stroup, CEO of , was paid more than $6 million.��(For 2015 pay, he was also No. 14.)
15. Olin, Joseph Rupp

Joseph Rupp, CEO of , made more than $5 million.��(For 2015 pay, he was No. 2.)
16. Panera Bread, Ronald Schaich

Ronald Schaich, CEO of��, made more than $4 million.��(For 2015 pay, he was also No. 16.)
17. Commerce Bancshares, David Kemper

David Kemper, CEO of Commerce , was paid more than $4 million.��(For 2015 pay, he was No. 19.)
18. Isle of Capri Casinos, Virginia M. McDowell

Virginia M. McDowell, CEO of , was paid more than $3 million.��(For 2015 pay, she was No. 26.)
19. Peabody Energy, Glenn L. Kellow

Glenn L. Kellow, CEO of Peabody Energy, was paid more than $3 million.��(For 2015 pay, he was No. 18.)
20. Spire, Suzanne Sitherwood

Suzanne Sitherwood, CEO of , was paid more than $3 million.��(For 2015 pay, she was No. 21.)
21. Esco Technologies, V.L. Richey Jr.

V.L. Richey Jr., CEO of , made more than $3 million.��(For 2015 pay, he was No. 22.)
22. Olin, John E. Fischer

John E. Fischer, CEO of , was paid more than $3 million.
23. Perficient, Jeffrey S. Davis

Jeffrey S. Davis, CEO of , was paid more than $2 million.��(For 2015 pay, he was also No. 23.)
24. Aegion, Charles R. Gordon

Charles R. Gordon, CEO of , was paid more than $2 million.��(For 2015 pay, he was No. 20.)
25. Edgewell Personal Care, David P. Hatfield

David P. Hatfield, CEO of , was paid more than $2 million.��(For 2015 pay, he was No. 11.)
26. Build-A-Bear Workshop, Sharon John

Sharon John, CEO of , was paid more than $1 million.��(For 2015 pay, she was No. 25.)
27. Cass Information Systems, Eric H. Brunngraber

Eric H. Brunngraber, CEO of , was paid more than $1 million.��(For 2015 pay, he was No. 29.)
28. Huttig Building Products, Jon Vrabely

Jon Vrabely, CEO of , was paid more than $1.5 million.��(For 2015 pay, he was No. 27.)
29. Enterprise Financial Services, Peter F. Benoist

Peter F. Benoist, CEO of , was paid more than $1 million.��(For 2015 pay, he was No. 33.)
30. Foresight Energy, Robert D. Moore

Robert D. Moore, CEO of , was paid more than $1 million.��(For 2015 pay, he was No. 40.)
31. American Railcar Industries, Jeffrey S. Hollister

Jeffrey S. Hollister, CEO of , was paid more than $1 million.��(For 2015 pay, he was No. 32.)
32. LMI Aerospace, Daniel G. Korte

Daniel G. Korte, CEO of , was paid more than $1 million.��(For 2015 pay, he was No. 28.)
33. Stereotaxis, William C. Mills

William C. Mills, of .��(For 2015 pay, he was No. 34.)
34. Reliv International, Robert L. Montgomery

Robert L. Montgomery is the CEO of .��(For 2015 pay, he was No. 36.)
35. Allied Healthcare Products, Earl R. Refsland

Earl R. Refsland is CEO of .��(For 2015 pay, he was No. 37.)
36. Peak Resorts, Timothy D. Boyd

Timothy D. Boyd is CEO of .��(For 2015 pay, he was No. 38.)
How much CEOs of local public companies made in 2016
| CEO | Business | Year | Salary | Bonus incentive | Stock | Options | Pension | All other | Total 2016 pay | Total 2015 pay | % change |
|---|---|---|---|---|---|---|---|---|---|---|---|
| Michael Neidorff | Centene | 2016 | $1,500,000 | $6,602,400 | $12,829,500 | $411,800 | $0 | $625,283 | $21,968,983 | $20,755,103 | 5.85% |
| Robert V. Vitale | Post Holdings | 2016 | $975,000 | $1,800,000 | $12,419,957 | $2,629,121 | $27,752 | $158,658 | $18,010,488 | $9,465,925 | 90.27% |
| David Farr | Emerson | 2016 | $1,300,000 | $1,700,000 | $7,368,000 | $0 | $4,258,000 | $511,533 | $15,137,533 | $15,313,813 | -1.15% |
| Timothy Wentworth [a] | Express Scripts | 2016 | $1,214,231 | $2,189,556 | $7,333,334 | $3,666,666 | $0 | $118,391 | $14,522,178 | $8,464,903 | 71.56% |
| John W. Eaves | Arch Coal | 2016 | $1,025,000 | $1,494,361 | $10,237,770 | $0 | $189,651 | $40,213 | $12,986,995 | $4,901,726 | 164.95% |
| Mark C. Trudeau | Mallinckrodt | 2016 | $1,038,461 | $1,587,500 | $5,876,436 | $3,900,004 | $0 | $159,340 | $12,561,741 | $9,728,506 | 29.12% |
| George Paz [b] | Express Scripts | 2016 | $754,379 | $724,129 | $6,833,334 | $3,416,666 | $0 | $188,293 | $11,916,801 | $14,835,587 | -19.67% |
| Hugh Grant | Monsanto | 2016 | $1,664,741 | $565,457 | $4,320,017 | $3,657,163 | $1,135,360 | $498,246 | $11,840,984 | $11,928,836 | -0.74% |
| A. Greig Woodring | Reinsurance Group | 2016 | $1,229,538 | $2,565,886 | $3,975,025 | $1,733,662 | $807,864 | $92,960 | $10,404,935 | $9,370,979 | 11.03% |
| Ronald J. Kruszewski | Stifel | 2016 | $200,000 | $3,021,000 | $6,000,000 | $0 | $0 | $92,235 | $9,313,235 | $1,237,276 | 652.72% |
| Diane M. Sullivan | Caleres | 2016 | $1,030,000 | $1,415,550 | $4,528,800 | $0 | $48,322 | $96,405 | $7,119,077 | $9,474,409 | -24.86% |
| Warner L. Baxter | Ameren | 2016 | $1,040,000 | $1,213,000 | $3,732,030 | $0 | $538,752 | $114,874 | $6,638,656 | $6,493,706 | 2.23% |
| Alan R. Hoskins [c] | Energizer | 2016 | $923,625 | $1,586,561 | $3,600,024 | $0 | $68,875 | $125,028 | $6,304,113 | $9,400,761 | -32.94% |
| John Stroup | Belden | 2016 | $868,750 | $1,660,750 | $1,825,283 | $1,525,278 | $273,681 | $100,466 | $6,254,208 | $6,921,110 | -9.64% |
| Joseph Rupp [d] | Olin | 2016 | $733,334 | $547,200 | $4,034,430 | $0 | $0 | $191,082 | $5,506,046 | $18,680,806 | -70.53% |
| Ronald Shaich | Panera Bread | 2016 | $873,320 | $2,019,875 | $1,311,079 | $0 | $0 | $42,451 | $4,246,725 | $4,934,479 | -13.94% |
| David Kemper | Commerce Bancshares | 2016 | $960,305 | $1,138,700 | $1,477,802 | $382,573 | $0 | $143,141 | $4,102,521 | $3,991,234 | 2.79% |
| Virginia M. McDowell | Isle of Capri Casinos [e] | 2016 | $782,750 | $714,490 | $1,519,376 | $816,453 | $0 | $0 | $3,833,069 | $1,795,675 | 113.46% |
| Glenn L. Kellow [f] | Peabody Energy | 2016 | $997,896 | $2,433,266 | $1,085,000 | $0 | $0 | $17,610 | $3,535,876 | $4,811,222 | -26.51% |
| Suzanne Sitherwood | Spire [g] | 2016 | $820,673 | $830,000 | $1,548,808 | $0 | $170,628 | $123,094 | $3,493,203 | $3,139,416 | 11.27% |
| V.L. Richey, Jr.�� | Esco Technologies | 2016 | $824,500 | $883,300 | $0 | $1,429,500 | $129,472 | $79,888 | $3,346,660 | $2,847,695 | 17.52% |
| John E. Fischer [h] | Olin | 2016 | $836,000 | $589,608 | $1,325,320 | $334,875 | $64,075 | $152,749 | $3,302,627 | $5,056,990 | -34.69% |
| Jeffrey S. Davis | Perficient | 2016 | $568,750 | $0 | $2,274,899 | $0 | $0 | $22,417 | $2,866,066 | $2,753,575 | 4.09% |
| Charles R. Gordon | Aegion Corporation | 2016 | $650,000 | $325,000 | $1,400,000 | $0 | $0 | $172,291 | $2,547,291 | $3,293,808 | -22.66% |
| David P. Hatfield [i] | Edgewell Personal Care | 2016 | $900,000 | $1,360,557 | $0 | $0 | $137,327 | $77,543 | $2,475,427 | $9,357,570 | -73.55% |
| Sharon John | Build-A-Bear Workshop | 2016 | $694,231 | $0 | $625,003 | $663,492 | $0 | $5,362 | $1,988,088 | $1,840,006 | 8.05% |
| Eric H. Brunngraber | Cass Information Systems | 2016 | $584,157 | $214,700 | $339,654 | $0 | $480,524 | $45,911 | $1,664,946 | $1,316,748 | 26.44% |
| Jon P. Vrabely | Huttig Building Products | 2016 | $547,115 | $766,615 | $250,000 | $0 | $0 | $11,221 | $1,574,951 | $1,490,350 | 5.68% |
| Peter F. Benoist | Enterprise Financial Services | 2016 | $516,375 | $260,015 | $259,350 | $0 | $0 | $92,388 | $1,128,128 | $1,018,872 | 10.72% |
| Robert D. Moore [j] | Foresight Energy | 2016 | $250,000 | $800,000 | $0 | $0 | $0 | $0 | $1,050,000 | $250,000 | 320.00% |
| Jeffrey S. Hollister | American Railcar Industries | 2016 | $350,000 | $159,328 | $524,997 | $0 | $0 | $7,950 | $1,042,275 | $1,145,516 | -9.01% |
| Daniel G. Korte | LMI Aerospace | 2016 | $500,000 | $0 | $500,007 | $0 | $0 | $8,935 | $1,008,942 | $1,429,805 | -29.43% |
| William C. Mills [k] | Stereotaxis | 2016 | $489,250 | $131,217 | $89,778 | $0 | $0 | $2,060 | $712,305 | $936,187 | -23.91% |
| Robert L. Montgomery | Reliv International | 2016 | $610,494 | $0 | $0 | $0 | $0 | $45,957 | $656,451 | $672,509 | -2.39% |
| Earl R. Refsland | Allied Healthcare Products | 2016 | $429,000 | $0 | $0 | $0 | $0 | $73,453 | $502,453 | $503,164 | -0.14% |
| Timothy D. Boyd | Peak Resorts | 2016 | $442,000 | $0 | $0 | $0 | $0 | $9,443 | $451,443 | $465,173 | -2.95% |
| Paul A. Novelly | FutureFuel | 2016 | $0 | $0 | $999 | $0 | $0 | $0 | $999 | $1,028 | -2.82% |
How much CEOs of local public companies made in 2016
[a] Wentworth became CEO on May 6, 2016. [b] Paz stepped down as CEO on May 6, 2016. [c] Hoskins became CEO in July 2015. [d] Rupp stepped down as CEO on May 1, 2016, and remains chairman. [e] Isle of Capri was acquired by Eldorado Resorts in May 2017. [f] Kellow became CEO in May 2015. [g] Spire is the former Laclede Group. [h] Fischer became CEO on May 1, 2016. [i] Hatfield became CEO on July 1, 2015. [j] Moore’s base salary is not directly paid, but reflects the portion of his compensation determined appropriate pursuant to the services agreement with Murray Energy Corporation. [k] Mills resigned as CEO in February 2017. Source: Company reports.
| CEO | Business | Year | Salary | Bonus incentive | Stock | Options | Pension | All other | Total 2016 pay | Total 2015 pay | % change |
|---|---|---|---|---|---|---|---|---|---|---|---|
| Michael Neidorff | Centene | 2016 | $1,500,000 | $6,602,400 | $12,829,500 | $411,800 | $0 | $625,283 | $21,968,983 | $20,755,103 | 5.85% |
| Robert V. Vitale | Post Holdings | 2016 | $975,000 | $1,800,000 | $12,419,957 | $2,629,121 | $27,752 | $158,658 | $18,010,488 | $9,465,925 | 90.27% |
| David Farr | Emerson | 2016 | $1,300,000 | $1,700,000 | $7,368,000 | $0 | $4,258,000 | $511,533 | $15,137,533 | $15,313,813 | -1.15% |
| Timothy Wentworth [a] | Express Scripts | 2016 | $1,214,231 | $2,189,556 | $7,333,334 | $3,666,666 | $0 | $118,391 | $14,522,178 | $8,464,903 | 71.56% |
| John W. Eaves | Arch Coal | 2016 | $1,025,000 | $1,494,361 | $10,237,770 | $0 | $189,651 | $40,213 | $12,986,995 | $4,901,726 | 164.95% |
| Mark C. Trudeau | Mallinckrodt | 2016 | $1,038,461 | $1,587,500 | $5,876,436 | $3,900,004 | $0 | $159,340 | $12,561,741 | $9,728,506 | 29.12% |
| George Paz [b] | Express Scripts | 2016 | $754,379 | $724,129 | $6,833,334 | $3,416,666 | $0 | $188,293 | $11,916,801 | $14,835,587 | -19.67% |
| Hugh Grant | Monsanto | 2016 | $1,664,741 | $565,457 | $4,320,017 | $3,657,163 | $1,135,360 | $498,246 | $11,840,984 | $11,928,836 | -0.74% |
| A. Greig Woodring | Reinsurance Group | 2016 | $1,229,538 | $2,565,886 | $3,975,025 | $1,733,662 | $807,864 | $92,960 | $10,404,935 | $9,370,979 | 11.03% |
| Ronald J. Kruszewski | Stifel | 2016 | $200,000 | $3,021,000 | $6,000,000 | $0 | $0 | $92,235 | $9,313,235 | $1,237,276 | 652.72% |
| Diane M. Sullivan | Caleres | 2016 | $1,030,000 | $1,415,550 | $4,528,800 | $0 | $48,322 | $96,405 | $7,119,077 | $9,474,409 | -24.86% |
| Warner L. Baxter | Ameren | 2016 | $1,040,000 | $1,213,000 | $3,732,030 | $0 | $538,752 | $114,874 | $6,638,656 | $6,493,706 | 2.23% |
| Alan R. Hoskins [c] | Energizer | 2016 | $923,625 | $1,586,561 | $3,600,024 | $0 | $68,875 | $125,028 | $6,304,113 | $9,400,761 | -32.94% |
| John Stroup | Belden | 2016 | $868,750 | $1,660,750 | $1,825,283 | $1,525,278 | $273,681 | $100,466 | $6,254,208 | $6,921,110 | -9.64% |
| Joseph Rupp [d] | Olin | 2016 | $733,334 | $547,200 | $4,034,430 | $0 | $0 | $191,082 | $5,506,046 | $18,680,806 | -70.53% |
| Ronald Shaich | Panera Bread | 2016 | $873,320 | $2,019,875 | $1,311,079 | $0 | $0 | $42,451 | $4,246,725 | $4,934,479 | -13.94% |
| David Kemper | Commerce Bancshares | 2016 | $960,305 | $1,138,700 | $1,477,802 | $382,573 | $0 | $143,141 | $4,102,521 | $3,991,234 | 2.79% |
| Virginia M. McDowell | Isle of Capri Casinos [e] | 2016 | $782,750 | $714,490 | $1,519,376 | $816,453 | $0 | $0 | $3,833,069 | $1,795,675 | 113.46% |
| Glenn L. Kellow [f] | Peabody Energy | 2016 | $997,896 | $2,433,266 | $1,085,000 | $0 | $0 | $17,610 | $3,535,876 | $4,811,222 | -26.51% |
| Suzanne Sitherwood | Spire [g] | 2016 | $820,673 | $830,000 | $1,548,808 | $0 | $170,628 | $123,094 | $3,493,203 | $3,139,416 | 11.27% |
| V.L. Richey, Jr.�� | Esco Technologies | 2016 | $824,500 | $883,300 | $0 | $1,429,500 | $129,472 | $79,888 | $3,346,660 | $2,847,695 | 17.52% |
| John E. Fischer [h] | Olin | 2016 | $836,000 | $589,608 | $1,325,320 | $334,875 | $64,075 | $152,749 | $3,302,627 | $5,056,990 | -34.69% |
| Jeffrey S. Davis | Perficient | 2016 | $568,750 | $0 | $2,274,899 | $0 | $0 | $22,417 | $2,866,066 | $2,753,575 | 4.09% |
| Charles R. Gordon | Aegion Corporation | 2016 | $650,000 | $325,000 | $1,400,000 | $0 | $0 | $172,291 | $2,547,291 | $3,293,808 | -22.66% |
| David P. Hatfield [i] | Edgewell Personal Care | 2016 | $900,000 | $1,360,557 | $0 | $0 | $137,327 | $77,543 | $2,475,427 | $9,357,570 | -73.55% |
| Sharon John | Build-A-Bear Workshop | 2016 | $694,231 | $0 | $625,003 | $663,492 | $0 | $5,362 | $1,988,088 | $1,840,006 | 8.05% |
| Eric H. Brunngraber | Cass Information Systems | 2016 | $584,157 | $214,700 | $339,654 | $0 | $480,524 | $45,911 | $1,664,946 | $1,316,748 | 26.44% |
| Jon P. Vrabely | Huttig Building Products | 2016 | $547,115 | $766,615 | $250,000 | $0 | $0 | $11,221 | $1,574,951 | $1,490,350 | 5.68% |
| Peter F. Benoist | Enterprise Financial Services | 2016 | $516,375 | $260,015 | $259,350 | $0 | $0 | $92,388 | $1,128,128 | $1,018,872 | 10.72% |
| Robert D. Moore [j] | Foresight Energy | 2016 | $250,000 | $800,000 | $0 | $0 | $0 | $0 | $1,050,000 | $250,000 | 320.00% |
| Jeffrey S. Hollister | American Railcar Industries | 2016 | $350,000 | $159,328 | $524,997 | $0 | $0 | $7,950 | $1,042,275 | $1,145,516 | -9.01% |
| Daniel G. Korte | LMI Aerospace | 2016 | $500,000 | $0 | $500,007 | $0 | $0 | $8,935 | $1,008,942 | $1,429,805 | -29.43% |
| William C. Mills [k] | Stereotaxis | 2016 | $489,250 | $131,217 | $89,778 | $0 | $0 | $2,060 | $712,305 | $936,187 | -23.91% |
| Robert L. Montgomery | Reliv International | 2016 | $610,494 | $0 | $0 | $0 | $0 | $45,957 | $656,451 | $672,509 | -2.39% |
| Earl R. Refsland | Allied Healthcare Products | 2016 | $429,000 | $0 | $0 | $0 | $0 | $73,453 | $502,453 | $503,164 | -0.14% |
| Timothy D. Boyd | Peak Resorts | 2016 | $442,000 | $0 | $0 | $0 | $0 | $9,443 | $451,443 | $465,173 | -2.95% |
| Paul A. Novelly | FutureFuel | 2016 | $0 | $0 | $999 | $0 | $0 | $0 | $999 | $1,028 | -2.82% |